Earthquakes, Databases and Python
Welcome. This is the webpage containing my answers to a technical assessment. The files referenced here are in the .Zip folder provided at the time of submission. Interesting visuals are in the end.
Objective
Write a Py application to access the USGS API. Next, query all the 2017 data and store in a relational database of your choice. Lastly perform specific queries and visualizations.
Creating the DB
Relevant Files - Create DB/Create_DB.py , Create DB/Create_tables.py
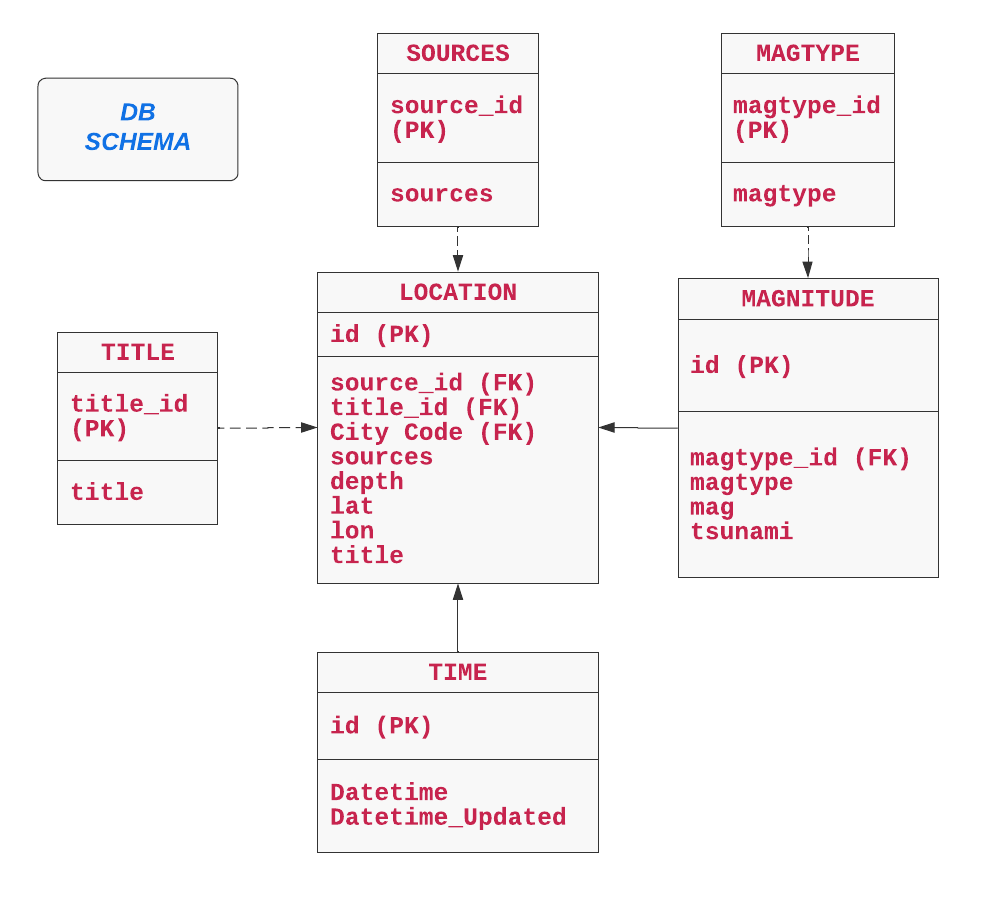
6 tables were created (code in Create_tables.py) based on the different categorical and non categorical variables and the schema is shown below. The database tool used is MySQL Workbench.
Data Retreival
Relevant Files - Data Retrieval/api_call.py , Data Retrieval/Get_Data.py
For the next step, the JSON response was parsed and stored in a dataframe. Since there are limits on the number of API call per second, the calls had to be incrementally made to avoid a 400 error. In this case data for each month is queried seperatly and appended to the aforementioned dataframe.
Populating the DB
Relevant Files - Data Retrieval/Add_Data_To_DB.py
This script combines the above two steps and creates a pipeline to query the API and insert into the database objects.
Analysis
Relevant Files - Data Analysis/Read_Data_From_DB.py , Data Analysis/Analysis.py
The first script here reads the db and returns the relevant tables as dataframes. The second script joins the dataframes on the common id and carries out analysis to answer the questions below.
Largest Earthquake in 2017
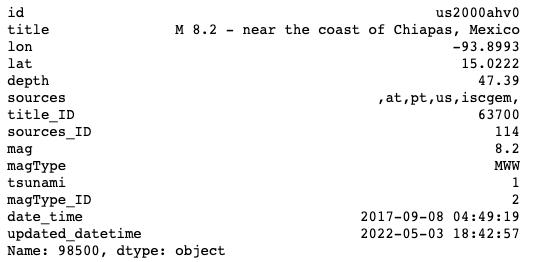
The following code queries the earthquake event with the largest magnitude.
largest_quake_row = master_df.iloc[master_df['mag'].idxmax()]
largest_quake_row
The answer is an 8.2 scale earthquake in Mexico.
Most Probable Hour of Day Bucketed by Magnitude
To answer this question, first bins were created according to earthquake magnitude.
bins = [0, 0.99, 1.99, 2.99, 3.99, 4.99, 5.99, 100]
category = ['0-1', '1-2', '2-3', '3-4', '4-5', '5-6', '>6']
master_df['mag_binned'] = pd.cut(master_df['mag'], bins, include_lowest=True, labels = category)
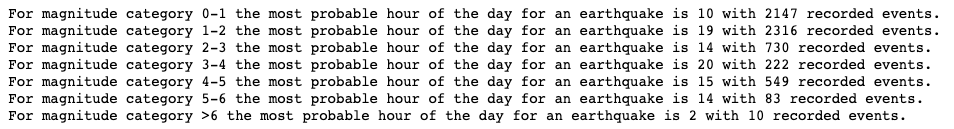
Next, the df is sliced for each bin, and then for each bin the hour of day with the most number of earthquakes was found. This is understood to be the hour of day which is most probable to have a earthquake with a magnitude in that particular bin.
for cat in category:
    hour_mode = int(master_df[master_df['mag_binned'] == cat]['datehour'].mode())
    hour_mode_counts = max(list(master_df[master_df['mag_binned'] == cat]['datehour'].value_counts()))
    print('For magnitude category {} the most probable hour of the day for an earthquake is {} with {} recorded events.'.format(cat, hour_mode, hour_mode_counts))
Result:
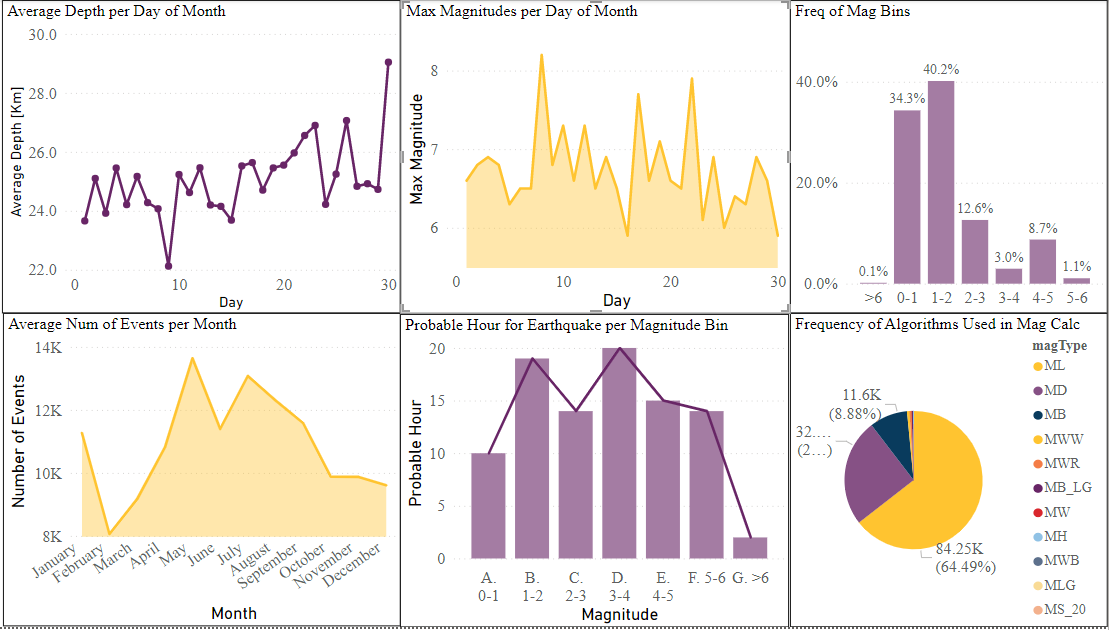
Visualizations
The following graphs/visuals were created in PowerBI:
References: