Case Studies - Stout
Welcome. This is the webpage containing my answers to the case studies.
Feel free to check out my website for a more detailed profile!
Customer Orders
Below is a table containing the desired metrics (scrollable).
| Current Year | Previous Year | Total Customers Current Year | Total Customers Previous Year | New Customers | Lost Customers | Existing Customers | Existing Customer Revenue Current Year | Existing Customer Revenue Previous Year | Existing Customer Revenue Growth | Revenue Lost From Attrition | Total Revenue Current Year | New Customer Revenue | |
|---|---|---|---|---|---|---|---|---|---|---|---|---|---|
| 2015 | 2014 | 231,294 | 0 | 231,294 | 0 | 0 | 0 | 0 | 0 | 0 | 29,036,749.19 | 29,036,749.19 | |
| 2016 | 2015 | 204,646 | 231,294 | 136,891 | 163,539 | 67,755 | 8,524,576.69 | 8,485,533.04 | 39,043.7 | 20,551,216.15 | 25,730,943.59 | 17,206,366.90 | |
| 2017 | 2016 | 249,987 | 204,646 | 173,449 | 128,108 | 76,538 | 9,648,282.02 | 9,584,424.96 | 63,857.1 | 16,146,518.63 | 31,417,495.03 | 21,769,213.01 |
Note:
For the current year of 2015, existing customers and their revenue from the previous year was assumed to be zero. Additionally, revenue lost from attrition was interpreted to be total revenue from previous year from customers lost (no longer in current year).
Fraud Detection
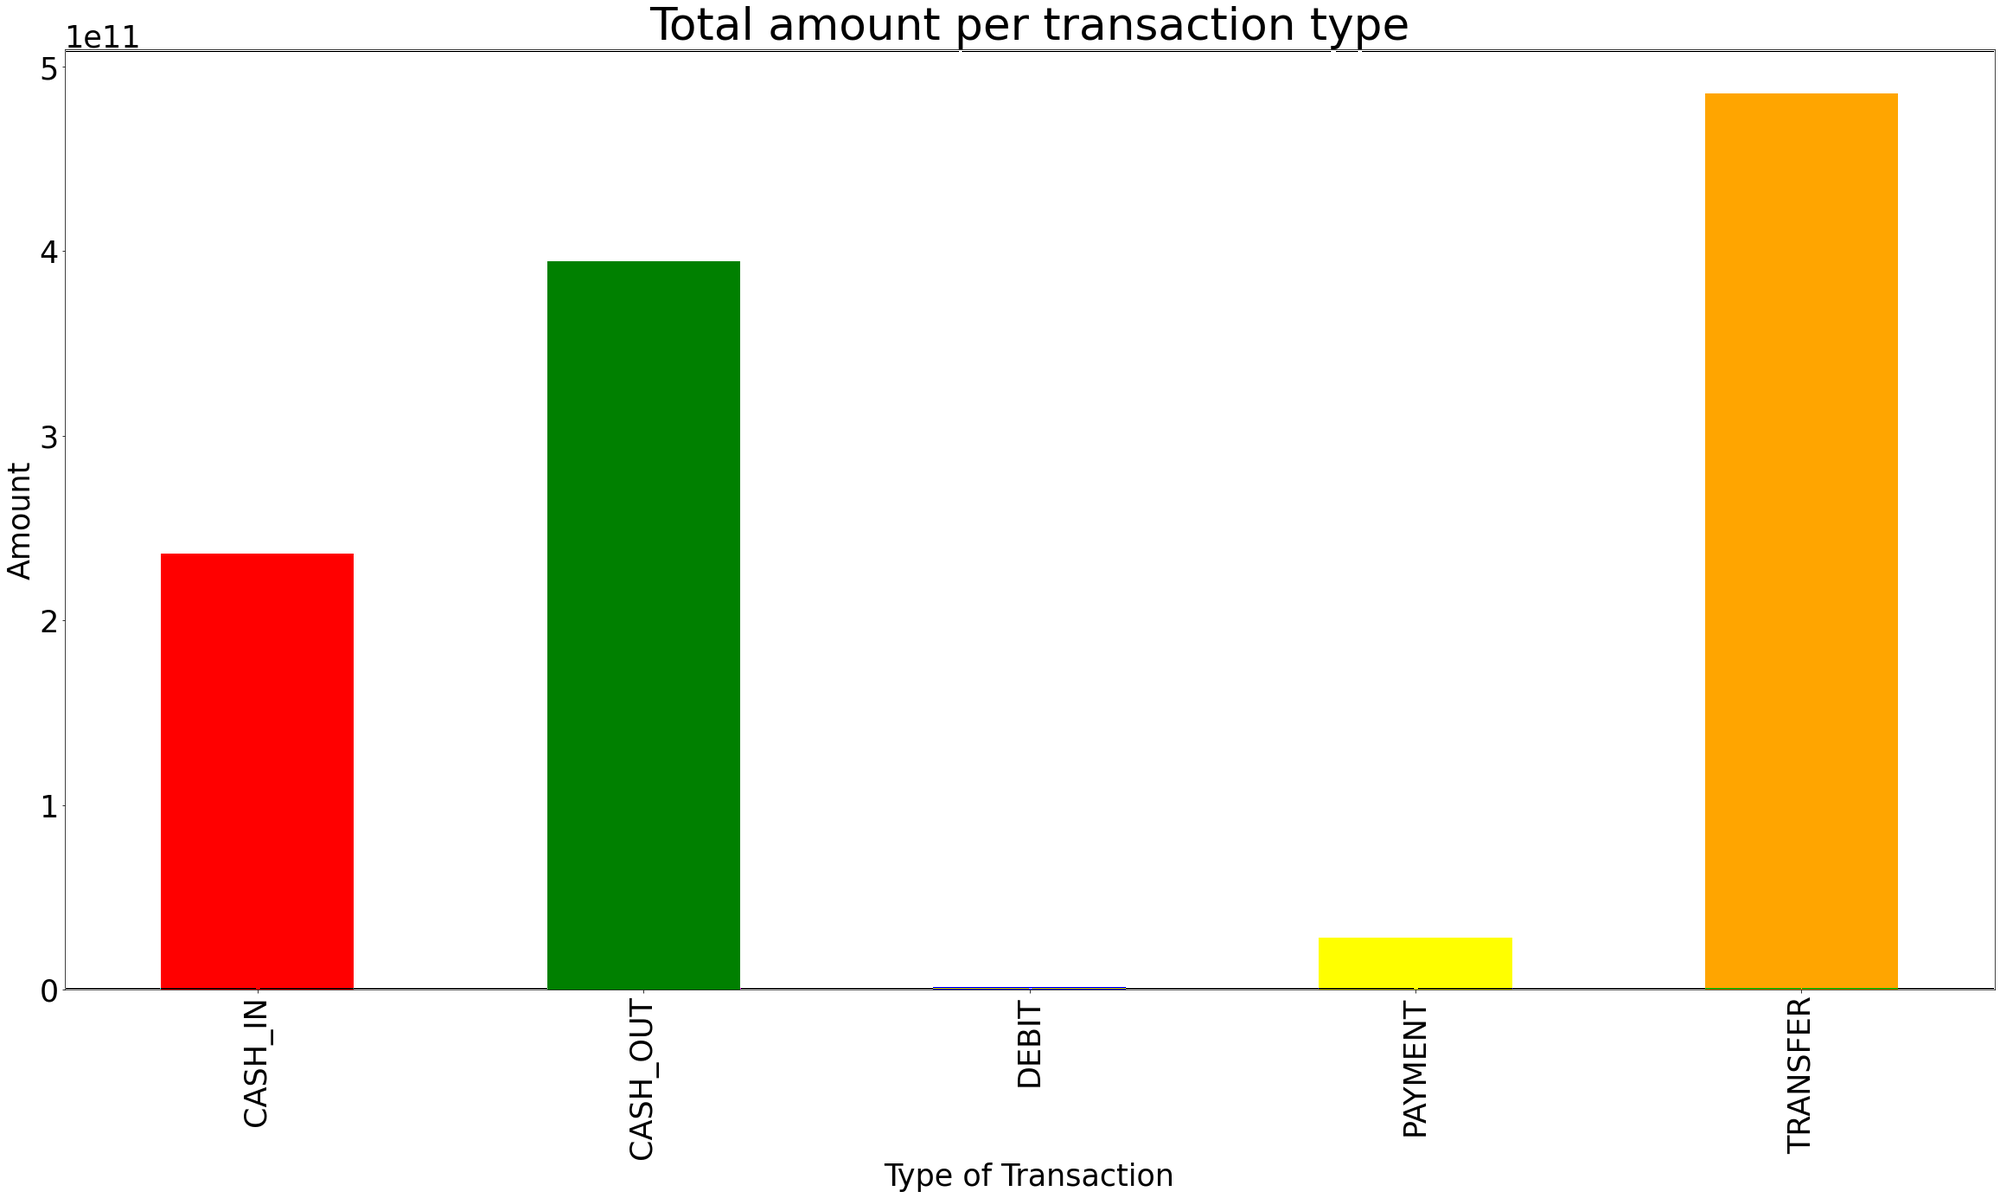
The dataset has about 6.3 million rows and 11 columns where each row represents a transaction. Column descriptions are available on kaggle. Also, there are no nulls in the table. For the transaction type, cash withdrawals and payment transactions are the most common, while transfers and debits make up a smaller fraction of the data.
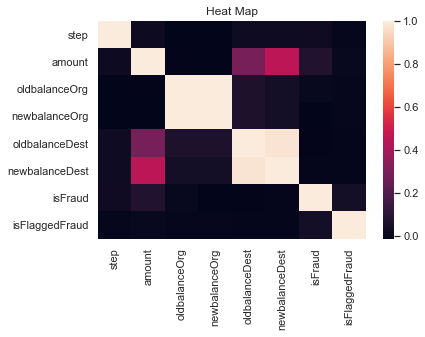
Here it can be seen that oldbalance* and newbalance* are highly correlated with each other since transaction amounts are typically a small proportion of account balances i.e, account balances have high correlations with themselves.
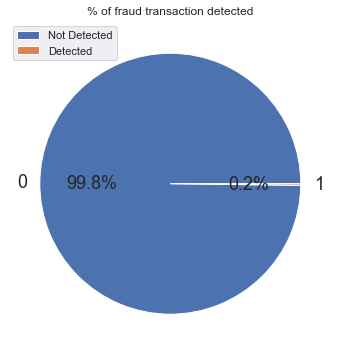
The dataset is highly imbalanced. Over 99.8% of the transaction records are non-fraudulent. Because only a tiny fraction of the dataset represents fraud, fraudulent transactions are likely to be under-represented in the models. To counter this, proper scaling of samples will take place.
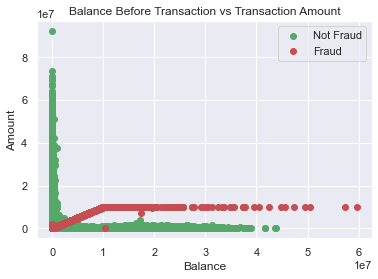
Below, the plots between amount and oldbalanceOrig can be seen. It can be concluded that amounts are skewed right—the vast majority of transactions are low amounts.
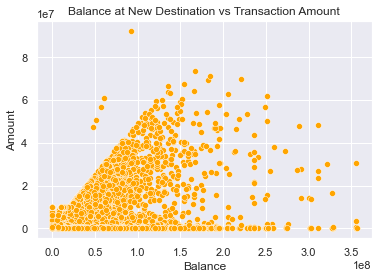
Lastly, there appears to be a weak positive relationship between amounts and destination account balances, which was observed earlier in the correlation matrix.
Logistic Regression approach
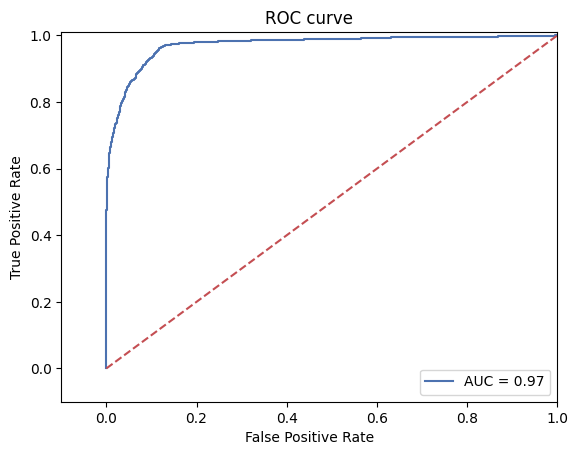
For this analysis only the row data TRANSFER and CASH_OUT types were retained. There was a 30/70 split between test/train sets. The y_score was found to be 0.9197251695947122 and precision score was 0.9740788254011161
The closer the ROC curve is to the upper left corner, it means that more positive samples are predicted to be 1, and more negative samples are not predicted to be 1.
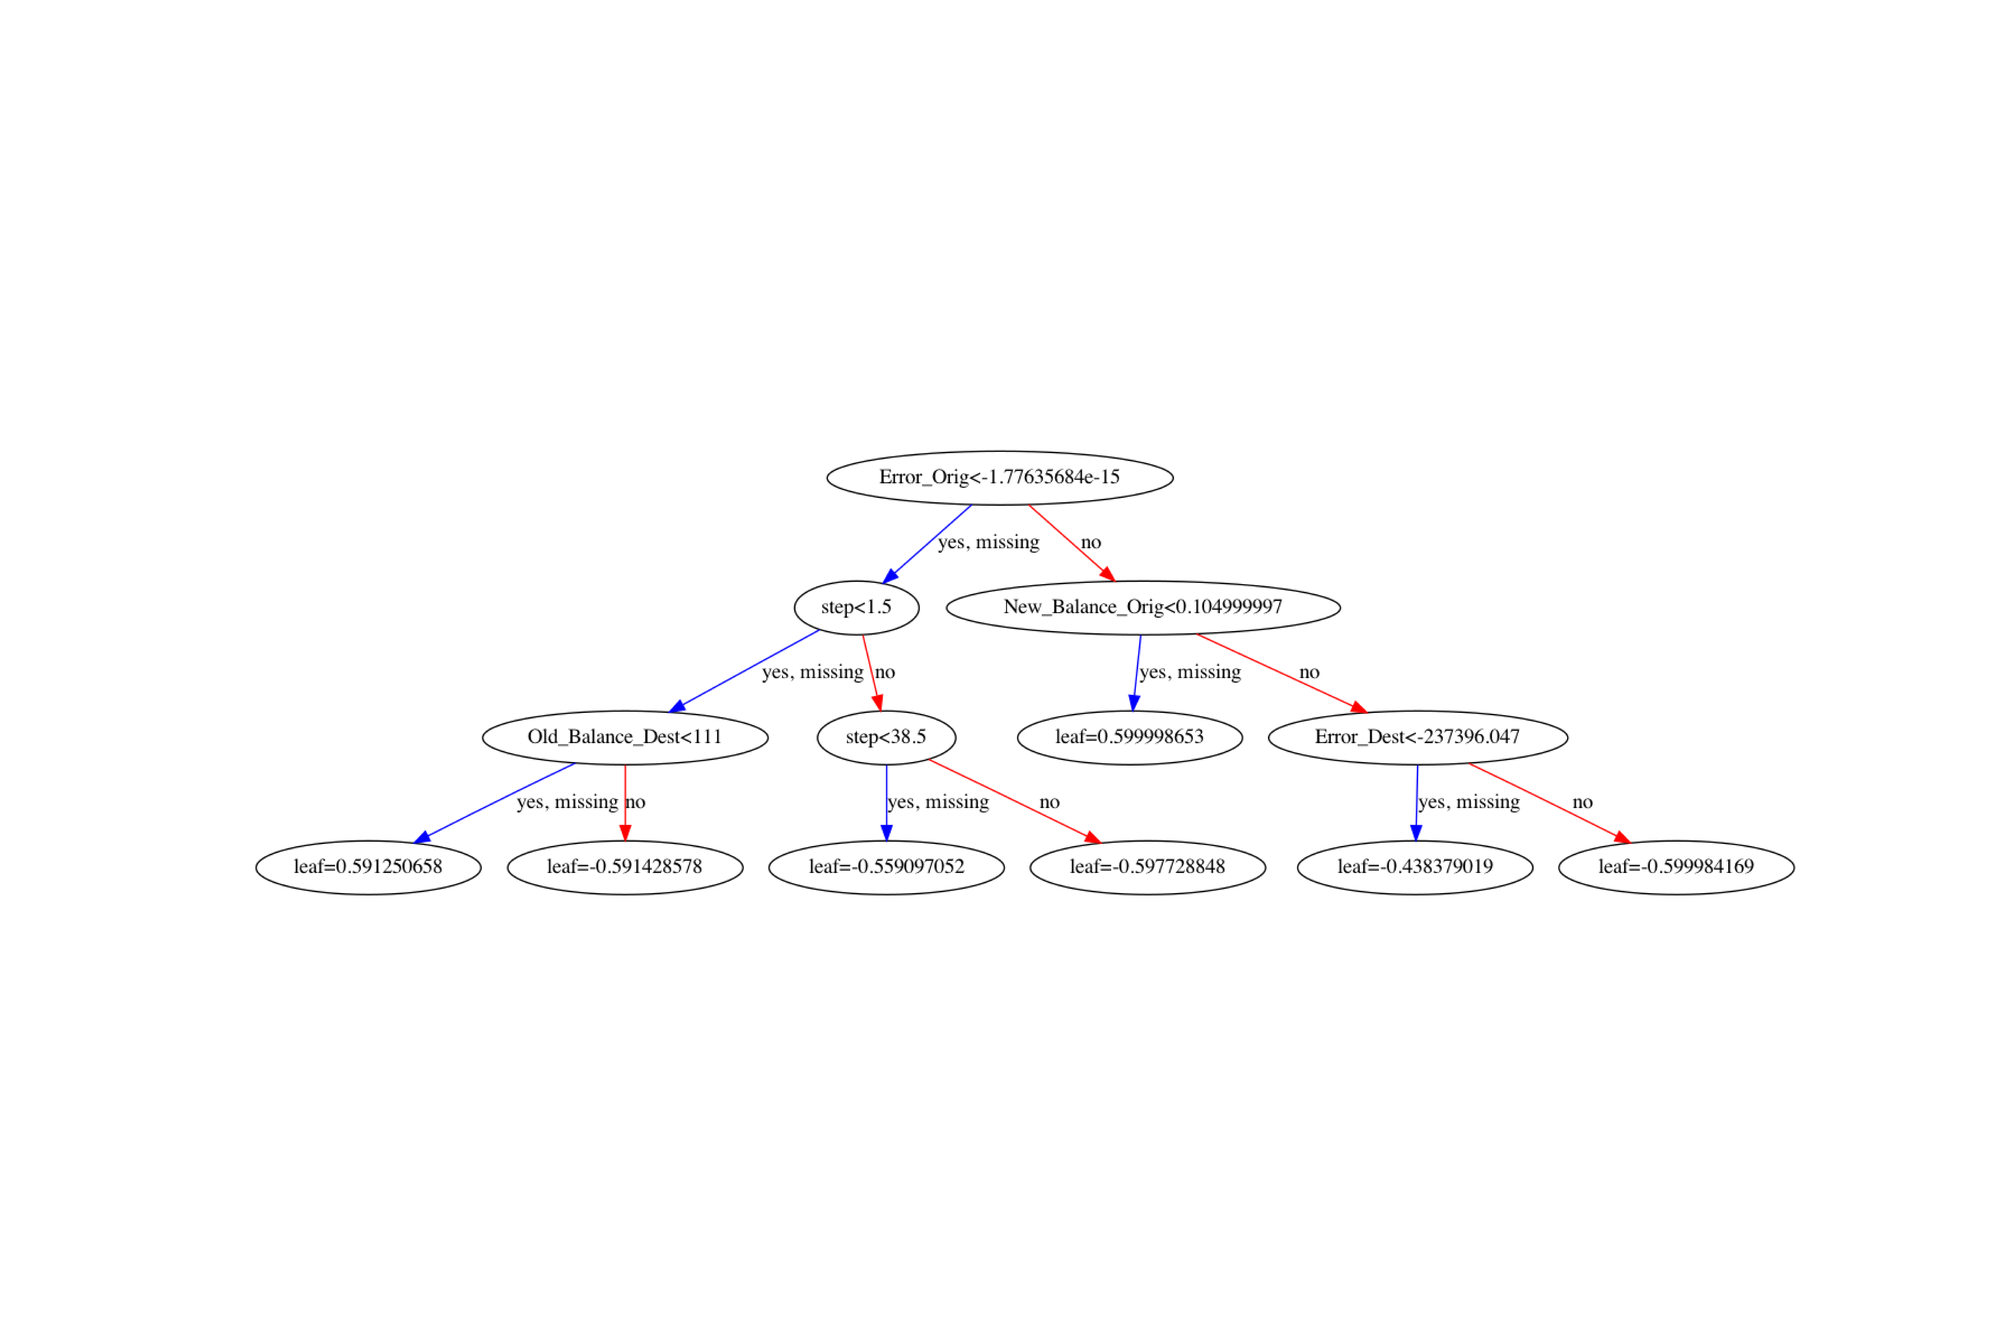
XGBoost (Gradient Boosting) approach
The XGBoost classifier was used to train the 20/80 train/test split data. Further, Error columns for Origin and Destination were added to normalize values. The accuracy was found to be 0.9999530726256983 and F1 macro score was 0.9937862376528303. Shown below is the corresponding decision tree generated.